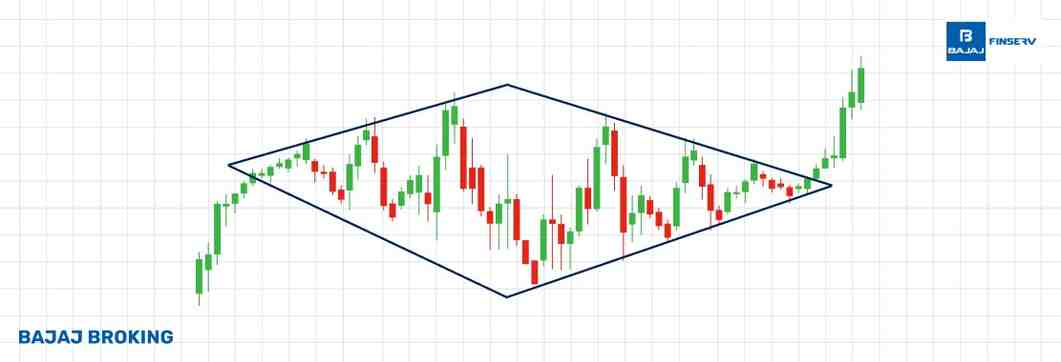
The diamond chart pattern is a technical analysis tool that traders use to identify potential trend reversals in financial markets. Recognizable by its distinctive diamond shape on price charts, this pattern can signal a shift in market direction, making it a valuable component of technical analysis.
What is a Diamond Chart Pattern?
A diamond chart pattern forms when price movements create a shape resembling a diamond on the chart. This pattern typically emerges after a significant uptrend or downtrend and indicates a period of consolidation before a potential reversal. The formation consists of a broadening phase, where prices exhibit higher highs and lower lows, followed by a contracting phase with lower highs and higher lows, culminating in the diamond shape. Traders view this pattern as a signal that the prevailing trend may be losing momentum, suggesting an impending reversal.
Formation of Diamond Chart Patterns
The formation of a diamond chart pattern begins with the price making higher highs and lower lows, creating a broadening structure. This phase reflects increasing volatility and indecision in the market. Subsequently, the price action starts to contract, forming lower highs and higher lows, which leads to the symmetrical diamond shape. This transition from expansion to contraction indicates a tussle between buyers and sellers, with neither side maintaining control, setting the stage for a breakout in either direction.
Importance of Diamond Pattern in Trading
The diamond pattern is significant in trading due to its ability to signal potential trend reversals. Although relatively rare, when this pattern appears, it can provide traders with early warnings of market shifts. By recognizing a diamond pattern, traders can prepare for possible changes in price direction, allowing them to adjust their positions accordingly. This foresight is crucial for effective risk management and optimizing trading strategies.
Interpretation of Diamond Chart Patterns
Interpreting diamond chart patterns involves analyzing the breakout direction. A breakout occurs when the price moves decisively beyond the pattern's boundaries. If the price breaks above the upper trendline of the diamond, it suggests a bullish reversal, indicating that prices may rise. Conversely, a breakout below the lower trendline signals a bearish reversal, implying that prices could decline. Volume plays a critical role in confirming these breakouts; a significant increase in volume during the breakout adds credibility to the signal.
Psychology Behind Diamond Chart Pattern
The market's phase of indecision and equilibrium is reflected in the diamond chart pattern. The expanding phase first shows that both buyers and sellers are driving prices to unprecedented heights, but neither is able to maintain control. The range of price swings gets smaller as the pattern moves into the contracting phase, indicating that the market is coming to an agreement and getting ready for a big move. This buildup often leads to a significant breakout as one side gains dominance, resulting in a trend reversal.
Types of Diamond Patterns: Top and Bottom
The two forms of diamond patterns—diamond tops and diamond bottoms—indicate distinct market circumstances.
Diamond Top (Bearish Reversal):
Formation: Occurs after a prolonged uptrend. The price action creates higher highs and lower lows, forming a broadening pattern, followed by lower highs and higher lows, leading to the diamond shape.
Indication: Signals a potential reversal from an uptrend to a downtrend.
Trading Strategy: Traders may look for a breakout below the lower trendline of the diamond, confirmed by increased volume, as a signal to enter short positions.
Diamond Bottom (Bullish Reversal):
Formation: Appears following a protracted downward trend. The price completes the diamond shape by making higher lows and lower highs after making lower lows and higher highs, which creates a spreading pattern.
Indication: Suggests a potential reversal from a downtrend to an uptrend.
Trading Strategy: Traders may wait for a breakout above the top trendline with increased volume as a signal to start long positions.
Understanding these patterns allows traders to anticipate possible market reversals and plan their trades accordingly.
How to Identify Diamond Patterns on Trading Charts
Identifying diamond patterns on trading charts requires careful observation of price movements and the application of trendlines. Here are steps to recognize these patterns:
Identify the Trend: Ascertain which trend is most likely to precede the diamond pattern. A diamond bottom is in a downward trend, whereas a diamond top is in an upward trend.
Observe Price Extremes: Look for a series of higher highs and lower lows forming a broadening pattern, indicating increased volatility and indecision.
Draw Trendlines: Connect the higher highs with a trendline and the lower lows with another trendline during the broadening phase. Then, as the price action contracts, draw trendlines connecting the lower highs and higher lows. The intersection of these trendlines should form a diamond shape.
Volume Analysis: Throughout the pattern's development, keep an eye on trade volume. Volume usually peaks during the spreading stage and then decreases during the contracting stage. The pattern is further supported if there is a noticeable spike in volume during the breakout.
Confirm the Breakout: Wait for the price to break decisively above or below the diamond's boundaries. The direction of the breakout indicates the potential trend reversal.
By following these steps, traders can effectively identify diamond patterns and make informed decisions based on the anticipated market movements.
Conclusion
The diamond chart pattern is a valuable tool in technical analysis, offering insights into potential trend reversals in financial markets. By understanding its formation, significance, and interpretation, traders can enhance their ability to anticipate market shifts and implement effective trading strategies. While the diamond pattern is relatively rare, its appearance can provide significant trading opportunities when accurately identified and confirmed with other technical indicators.


