


What does a hammer candlestick look like?
- Answer Field
-
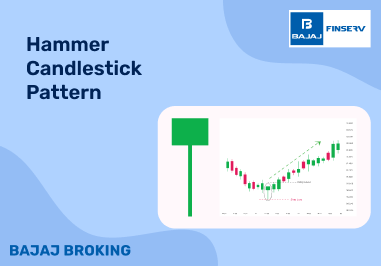
A hammer candlestick has a small body at the top and a long lower wick, resembling a hammer. This pattern is easy to recognize and is often used by traders to identify potential reversals. The long lower wick represents strong buying pressure after a decline in price, signaling a potential bullish move.


